An Examination of Batting Statistics

This series of articles will dive into a handful of the better-known statistics, define them in common language, and examine the pros and cons of using them. Here, we will compare Batting Average, Slugging Percentage, On-Base Percentage, and OPS (On Base Percentage plus Slugging Percentage).
The Batting Average (abbreviation: AVG) was one of the first measures of performance that was applied to baseball batters. Per Wikipedia, it was a statistic that was first used in Cricket. Its calculated by
(# Base Hits) / (# At Bats)
An “At Bat” is either a ball put in play (whether a base hit, an error, or an out) or a strikeout.
Batting Average is therefore a ratio of the number of times a batter hits safely compared to the total number of balls put in play (plus strikeouts). If a batter gets a base hit every time she has an At Bat, her batting average would be 1.000. If she gets out every time she is up, then her batting average would be 0.000. In Major League Baseball, any batter with a career batting average over 0.300 is pretty much guaranteed to be a Hall of Famer, and it means that every time the batter gets an At Bat, there is a 30% chance that he will get a base hit. In the 2009 College season, 23 Softball teams had batting averages over 0.300, while 141 Baseball teams had batting averages over 0.300.
Batting Average provides a basic yard stick with which to compare batters, teams, and eras, but it has its drawbacks. For example, it does not account for extra base hits so a single, double, triple and home run all have the same weight (i.e. a batter that hits 3 singles in 10 tries is rated equal to a batter that hits 3 home runs in 10 tries). Additionally, walks are not counted directly and are treated as a neutral event, where clearly a team benefits when a batter walks. As a result, there are better statistics that can be used to measure a batter’s performance.
Slugging Percentage (SLG) is similar to Batting Average, but it accounts for total bases hit instead of just number of hits. Its formula is weighted to include extra base hits and is
(# Total Bases) / (# At Bats)
A home run counts as 4 bases, a triple 3, a double 2 and a single as 1. A batter’s SLG is always at least as high as her AVG, a batter’s “power” or ability to hit extra base hits can be judged by subtracting her AVG from her SLG. SLG provides different information than AVG, and they should both be examined together to get a more complete picture of what a particular batter does.
Note, though, that SLG also does not account for walks. Walks have been a measure of poor pitching performance for decades, but have only recently been viewed as a positive result for batters. The batting statistic that accounts for walks is On Base Percentage (OBP). On Base Percentage is
(# times reached base safely) / (# Plate Appearance)
where a Plate Appearance occurs any time the batter gets up to bat.
“# times reached base safely” can sometimes include reaching base safely by error, but typically does not. Usually only a base hit, a walk, or a hit-by-pitch count for OBP.

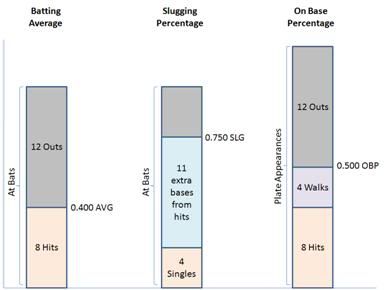
Say a batter gets 4 singles, a double, a triple, a home run, and 4 walks in 24 Plate Appearances. The image to the right compares her Batting Average, her Slugging Percentage, and her On Base Percentage. Every 10 times she gets an At Bat, we can expect her to get a base hit around 4 times (AVG), but to have generated about 7.5 bases. Note that On Base Percentage takes into account Plate Appearances instead of At-Bats, so that there is more data examined (because walks are included), and we would expect our batter to reach base about 5 times for every 10 plate appearances.
So we have SLG which accounts for extra base hits but not walks, and OBP which accounts for walks but does not account for extra base hits. The common measure used to account for both is OPS, which is merely On Base Percentage Plus Slugging. In our batter’s case, we would add 0.500 to 0.750 to get a total of 1.275. For a mathematician, it is weird that OPS is a viable statistic – just looking at the graph, we can see that singles are counted twice and outs hit into are counted by some fraction greater than 1. Nevertheless, OPS has been shown to have a high correlation to scoring runs in baseball.
Understanding what statistics actually measure helps a coach make better decisions. I have found that OPS does a decent job of rating batters in Softball and helps me set my lineup in a way to score the most runs.
BellaOnline Softball Subject List: Coach´s Box, Health & Medical, History of Softball, International Softball, Organizations, Parents , Professional Softball, Reviews, Rules & Regulations, Scorekeeping, Stats & Analysis, Travel Ball |
This site needs an editor - click to learn more!
You Should Also Read:
Contributors to Winning PCT in College Softball
Revisiting Contributors to Winning PCT
More Contributors to Winning Percentage
Related Articles
Editor's Picks Articles
Top Ten Articles
Previous Features
Site Map
Content copyright © 2023 by Don McKay. All rights reserved.
This content was written by Don McKay. If you wish to use this content in any manner, you need written permission. Contact
BellaOnline Administration
for details.


